Tidy Tuesday - 22OCT2024

Tidy Tuesday | Week 43 | 22-10-2024

Tidy Tuesday
code
analysis
Author

Prasaath Sastha

Published

October 23, 2024

This is my first tidy Tuesday challenge.

Introduction to Tidy Tuesday

This data is obtained from the Tidy Tuesday repository hosted on github. Side note: The tidy Tuesday repository gets updated with a new data set every Tuesday, and people all around the world use this data to produce some awesome visualization and shiny apps.

This is the first Dataset I am working on, and I am writing this quarto markdown as I go along. I have come across a lot of data scientists that do this in a R script to produce a plot or a graphic. And to me, I choose to do this in a markdown format, because I simply love the quarto platform. I am a big notion person, like half my life is on notion. So, using quarto with all the markdown and code execution functionality is like Disney land to me.

Apologies if I am boring you, since this is my first post I am just going over what happening in my head at this time. This blabber will not be present on the future posts.

So lets get started, the data we are going to read and work on are released on 22 OCT 2024.

The libraries that I would like to use on any R project for efficiency are

Code
# Load libraries

library(tidyverse) # This is a collection of packages that is used for data exploration, wrangling and plotting.
library(tidytuesdayR) # This package is used to connect to the tidy Tuesday repo for the data
library(knitr)
# Library that plays a huge role in improving test plot aesthetics
library(patchwork)
library(ggrepel)
library(glue) 
library(ggtext) 
library(showtext)

# Libraries for Maps
library(tmap)
library(sf)
library(rnaturalearth)

Now the tidytuesdayR package helps us access the data set that is present in the git hub repo.

Code
tuesdata <- tt_load("2024-10-22")

cia_factbook <- tuesdata$cia_factbook

glimpse(cia_factbook)
Table 1
Rows: 259
Columns: 11
$ country                 <chr> "Russia", "Canada", "United States", "China", …
$ area                    <dbl> 17098242, 9984670, 9826675, 9596960, 8514877, …
$ birth_rate              <dbl> 11.87, 10.29, 13.42, 12.17, 14.72, 12.19, 19.8…
$ death_rate              <dbl> 13.83, 8.31, 8.15, 7.44, 6.54, 7.07, 7.35, 7.3…
$ infant_mortality_rate   <dbl> 7.08, 4.71, 6.17, 14.79, 19.21, 4.43, 43.19, 9…
$ internet_users          <dbl> 40853000, 26960000, 245000000, 389000000, 7598…
$ life_exp_at_birth       <dbl> 70.16, 81.67, 79.56, 75.15, 73.28, 82.07, 67.8…
$ maternal_mortality_rate <dbl> 34, 12, 21, 37, 56, 7, 200, 77, 51, 97, 540, N…
$ net_migration_rate      <dbl> 1.69, 5.66, 2.45, -0.32, -0.15, 5.74, -0.05, 0…
$ population              <dbl> 142470272, 34834841, 318892103, 1355692576, 20…
$ population_growth_rate  <dbl> -0.03, 0.76, 0.77, 0.44, 0.80, 1.09, 1.25, 0.9…
Using glimpse we can see that the data set has 259 observations over 11 variables. On a superficial view, it appears that the data set contains variables such as area, birth rate, death rate, and so on with respect to each country.

Now, since we have come to an understanding that each of the variable is associated with a country, we can go on start making basic structure for how we are going to analyze or visualize the data.

After this step, I would like to examine each of the variable by summarizing or plotting to see if there are any null values or extreme outliers that needs to be evaluated further. Since all the variables except the country are numbers or doubles there are a list of things I like to check before proceeding

  • Missing values and their representation
  • Negative values (appropriateness)
  • Minimum and Maximum (context specific)
  • Data format

If it is a categorical variable, i always check for duplicates, and similar names.

Data Dictionary from the CIA factbook data set

variable class description
country integer Name of the country (factor with 259 levels).
area integer Total area of the country (in square kilometers).
birth_rate double Birth rate (number of live births per 1,000 people).
death_rate double Death rate (number of deaths per 1,000 people).
infant_mortality_rate double Infant mortality rate (number of deaths of infants under one year old per 1,000 live births).
internet_users integer Number of internet users.
life_exp_at_birth double Life expectancy at birth (in years).
maternal_mortality_rate integer Maternal mortality rate (number of maternal deaths per 100,000 live births).
net_migration_rate double Net migration rate (number of migrants per 1,000 people).
population integer Total population of the country.
population_growth_rate double Population growth rate (multiplier).
Code
summarytable <- summary(cia_factbook)

kable(summarytable)
country area birth_rate death_rate infant_mortality_rate internet_users life_exp_at_birth maternal_mortality_rate net_migration_rate population population_growth_rate
Length:259 Min. : 0 Min. : 6.72 Min. : 1.530 Min. : 1.810 Min. : 464 Min. :49.44 Min. : 2.0 Min. :-113.5100 Min. :4.800e+01 Min. :-9.730
Class :character 1st Qu.: 616 1st Qu.:11.84 1st Qu.: 5.930 1st Qu.: 6.185 1st Qu.: 86400 1st Qu.:67.00 1st Qu.: 20.0 1st Qu.: -2.0150 1st Qu.:3.266e+05 1st Qu.: 0.260
Mode :character Median : 51197 Median :16.89 Median : 7.630 Median : 13.985 Median : 716400 Median :74.36 Median : 65.5 Median : -0.0450 Median :5.220e+06 Median : 1.020
NA Mean : 530888 Mean :19.66 Mean : 7.907 Mean : 24.484 Mean : 8311771 Mean :71.83 Mean : 178.0 Mean : -0.1816 Mean :3.229e+07 Mean : 1.101
NA 3rd Qu.: 338145 3rd Qu.:24.91 3rd Qu.: 9.450 3rd Qu.: 38.655 3rd Qu.: 4200000 3rd Qu.:78.29 3rd Qu.: 240.0 3rd Qu.: 1.2575 3rd Qu.:1.826e+07 3rd Qu.: 1.920
NA Max. :17098242 Max. :46.12 Max. :17.490 Max. :117.230 Max. :389000000 Max. :89.57 Max. :2054.0 Max. : 83.8200 Max. :1.356e+09 Max. : 9.370
NA NA’s :2 NA’s :35 NA’s :34 NA’s :35 NA’s :46 NA’s :35 NA’s :75 NA’s :37 NA’s :21 NA’s :26
Code
# Creating some general variables for names and titles for axis and legenda

title_area <- "Area"
title_birth_rate <- "Birth Rate"
title_death_rate <- "Death Rate"
title_infantMR <- "Infant Mortality Rate"
title_maternalMR <- "Maternal Mortality Rate"
title_interetuser <- "Internet Users"
title_netmigration <- "Net Migration Rate"
title_population <- "Population"

t_population_growth_rate <- tibble(title = "Population Growth Rate")
t_area <- tibble(title = "Area", unit = "Sq Km")
t_birth_rate <- tibble(title = "Birth Rate", unit = "live births per 1,000 people")
t_death_rate <- tibble(title = "Death Rate", unit = "deaths per 1,000 people")
t_infantMR <- tibble(title = "Infant Mortality Rate", unit = "deaths of infants under one year old per 1,000 live births")
t_maternalMR <- tibble(title = "Maternal Mortality Rate", unit = "maternal deaths per 100,000 live births")
t_interetuser <- tibble(title = "Internet Users", unit = "n")
t_netmigration <- tibble(title = "Net Migration Rate", unit = "migrants per 1,000 people")
t_population <- tibble(title = "Population", unit = "n")
Code
boxplot <- function(data, var, xlab = "X-Axis", ylab = "Y-Axis", main = "My Scatter Plot", col = "blue") {
  # Create a dataframe from x and y

  # Generate the plot
  ggplot(data = data, aes(x = {{var}})) +
    geom_boxplot(color = col, outlier.colour = "red", na.rm = TRUE, orientation = "y")+
    scale_y_continuous(labels = NULL)+
    labs(x = xlab, y = ylab)
}


A <- boxplot(cia_factbook, area, xlab = paste(t_area$title, "(", t_area$unit, ")"), ylab = "")
B <- boxplot(cia_factbook, birth_rate , xlab = paste(t_birth_rate$title, "(", t_birth_rate$unit, ")"), ylab = "")
C <- boxplot(cia_factbook, death_rate, xlab = paste(t_death_rate$title, "(", t_death_rate$unit, ")"), ylab = "")
D <- boxplot(cia_factbook, infant_mortality_rate , xlab = paste(t_infantMR$title, "(", t_infantMR$unit, ")"), ylab = "")
E <- boxplot(cia_factbook, internet_users , xlab = paste(t_interetuser$title, "(", t_interetuser$unit, ")"), ylab = "")
F <- boxplot(cia_factbook, maternal_mortality_rate , xlab = paste(t_maternalMR$title, "(", t_maternalMR$unit, ")"), ylab = "")
G <- boxplot(cia_factbook, net_migration_rate , xlab = paste(t_netmigration$title, "(", t_netmigration$unit, ")"), ylab = "")
H <- boxplot(cia_factbook, population , xlab = paste(t_population$title, "(", t_population$unit, ")"), ylab = "")
I <- boxplot(cia_factbook, population_growth_rate , xlab = t_population_growth_rate$title, ylab = "")


A+B+C+D+E+F+G+H+I+ plot_layout(ncol = 2)
Figure 1

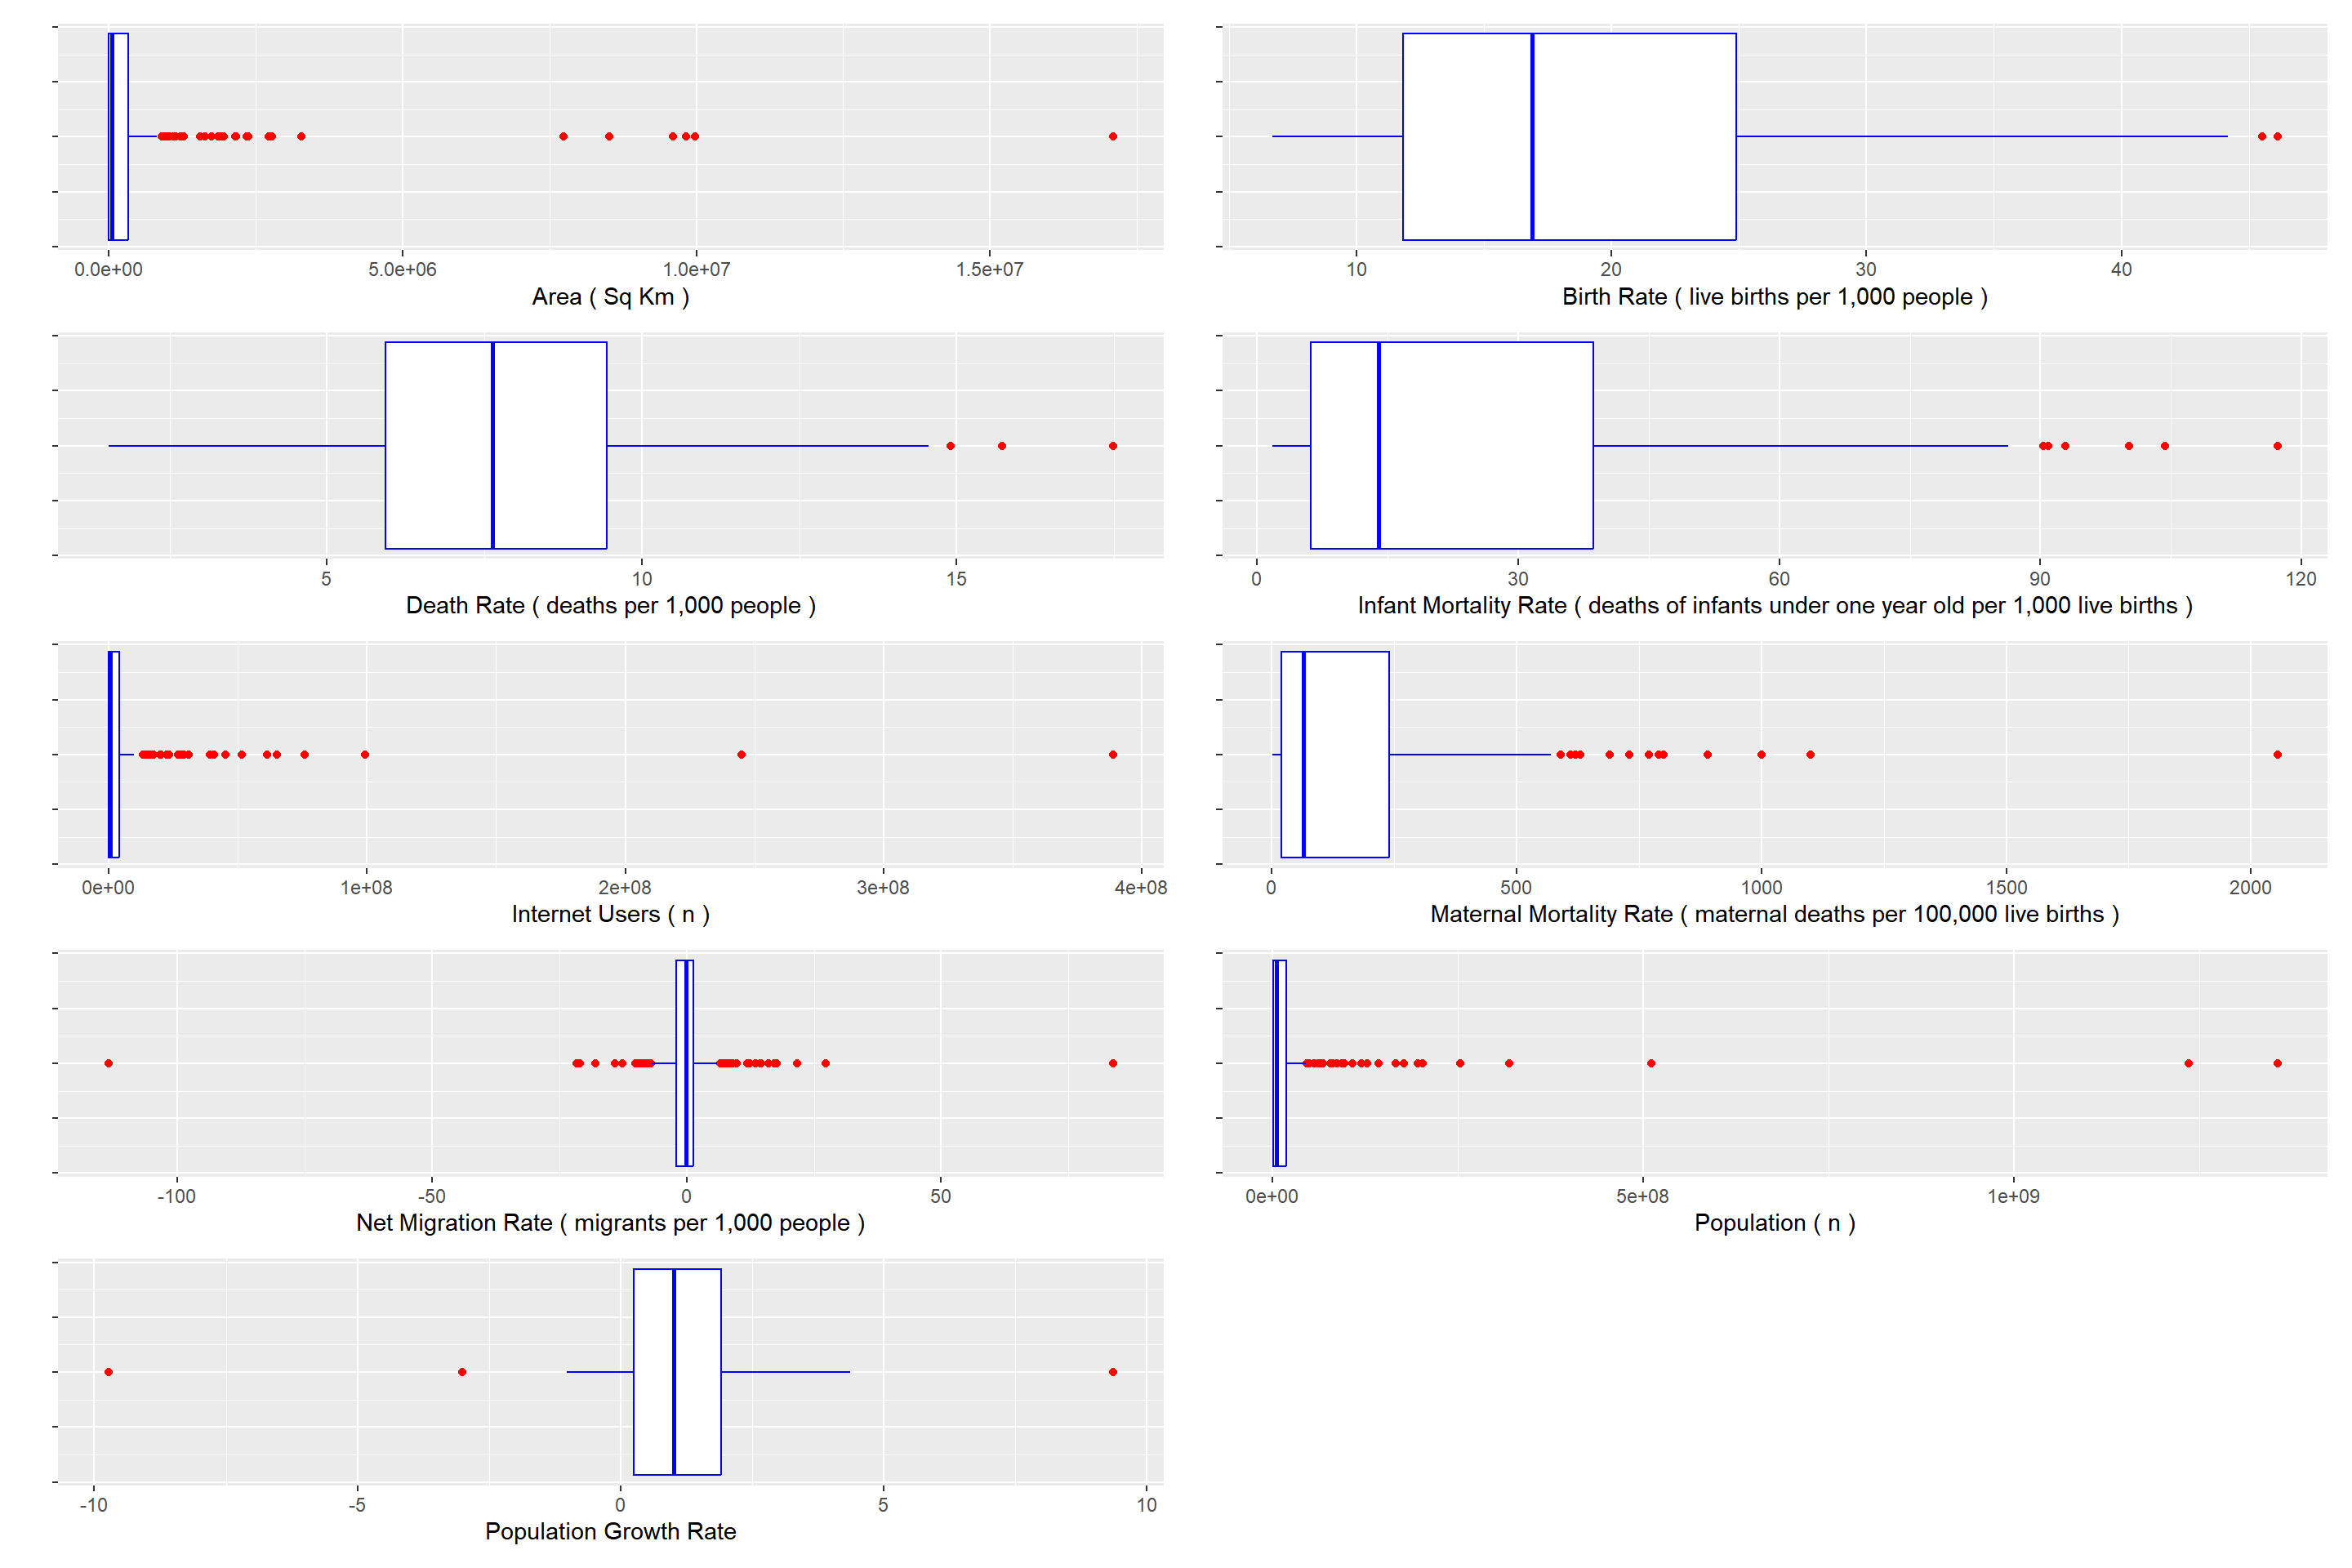
From the above series of plots we can see there are a number of outliers in each variable, they can be investigated individually by checking what country those variables are at the extreme ends and check them for coherence with real world knowledge.

And there are also missing values in all of the variables, which can be seen from the summary tables. Since its listed as NA’s we are going to assume that the relevant data is not available for those variables. Generally, I would investigate the root-cause for missing data and the outliers, but for this tidy Tuesday visualization, I am willing to assume that these are genuine representations of the data.

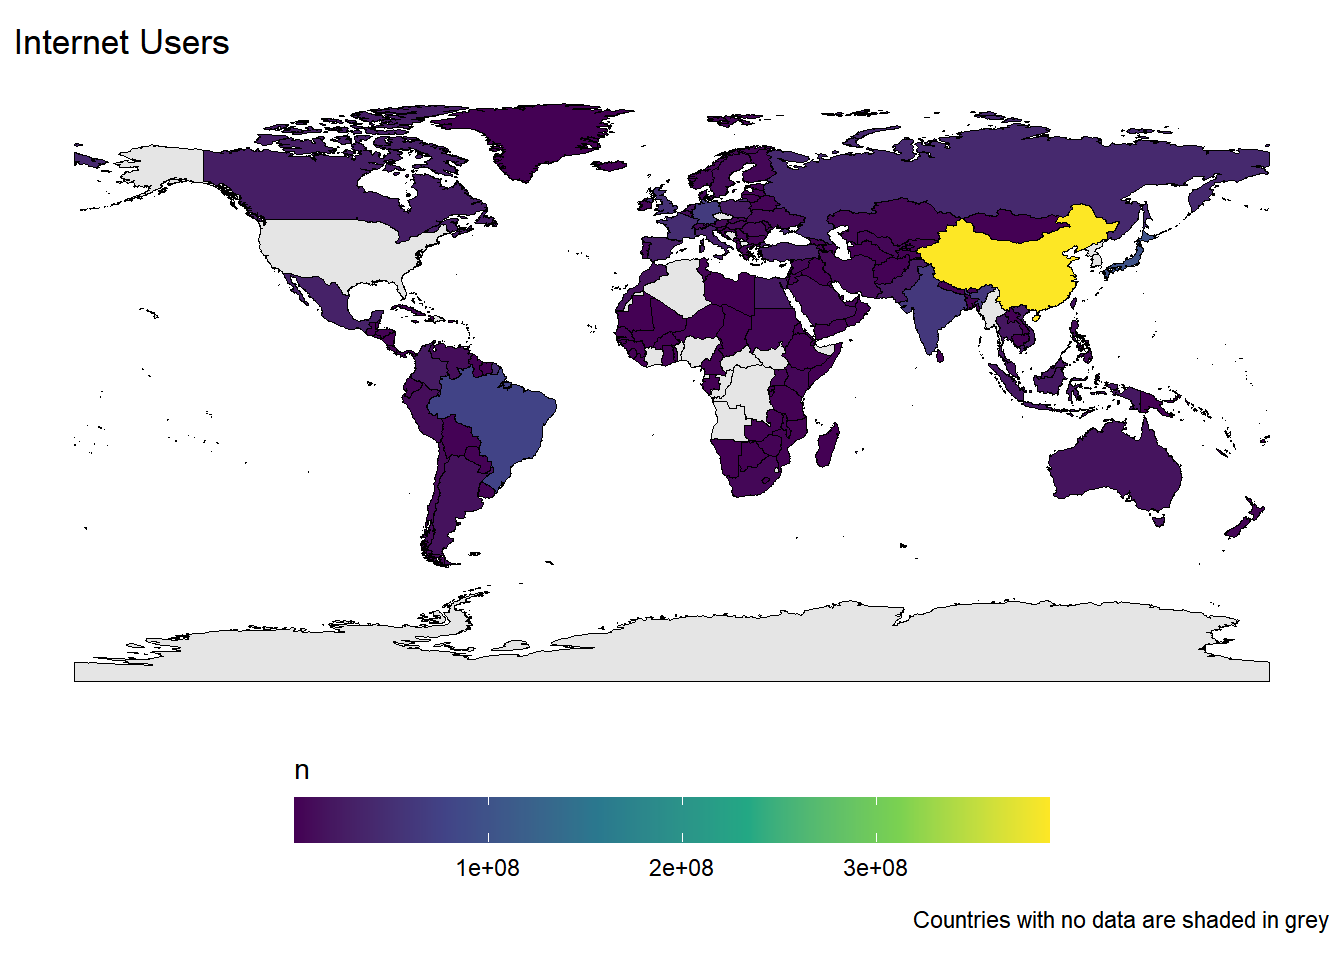
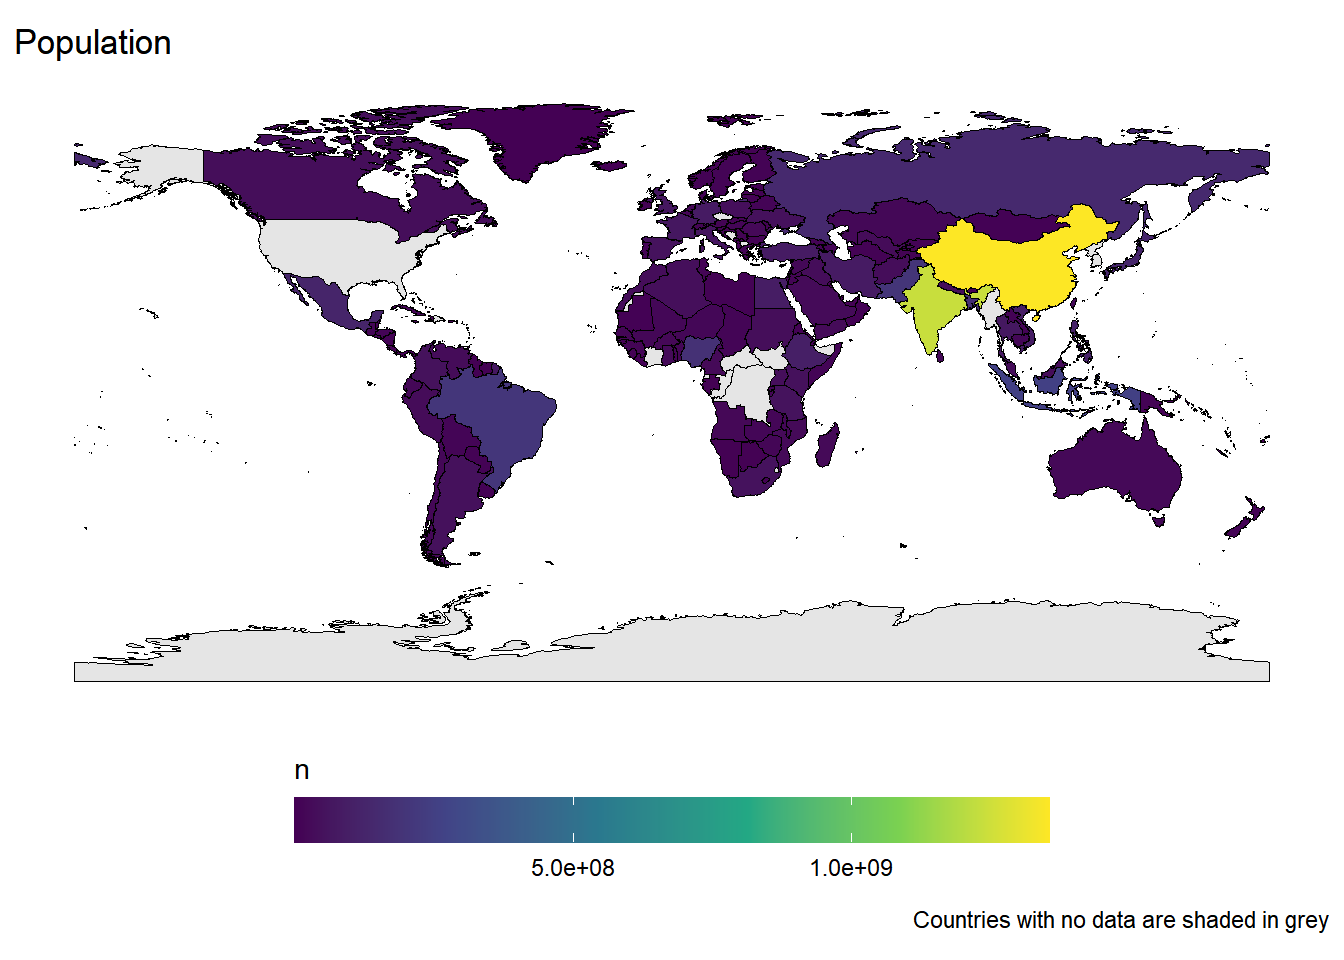
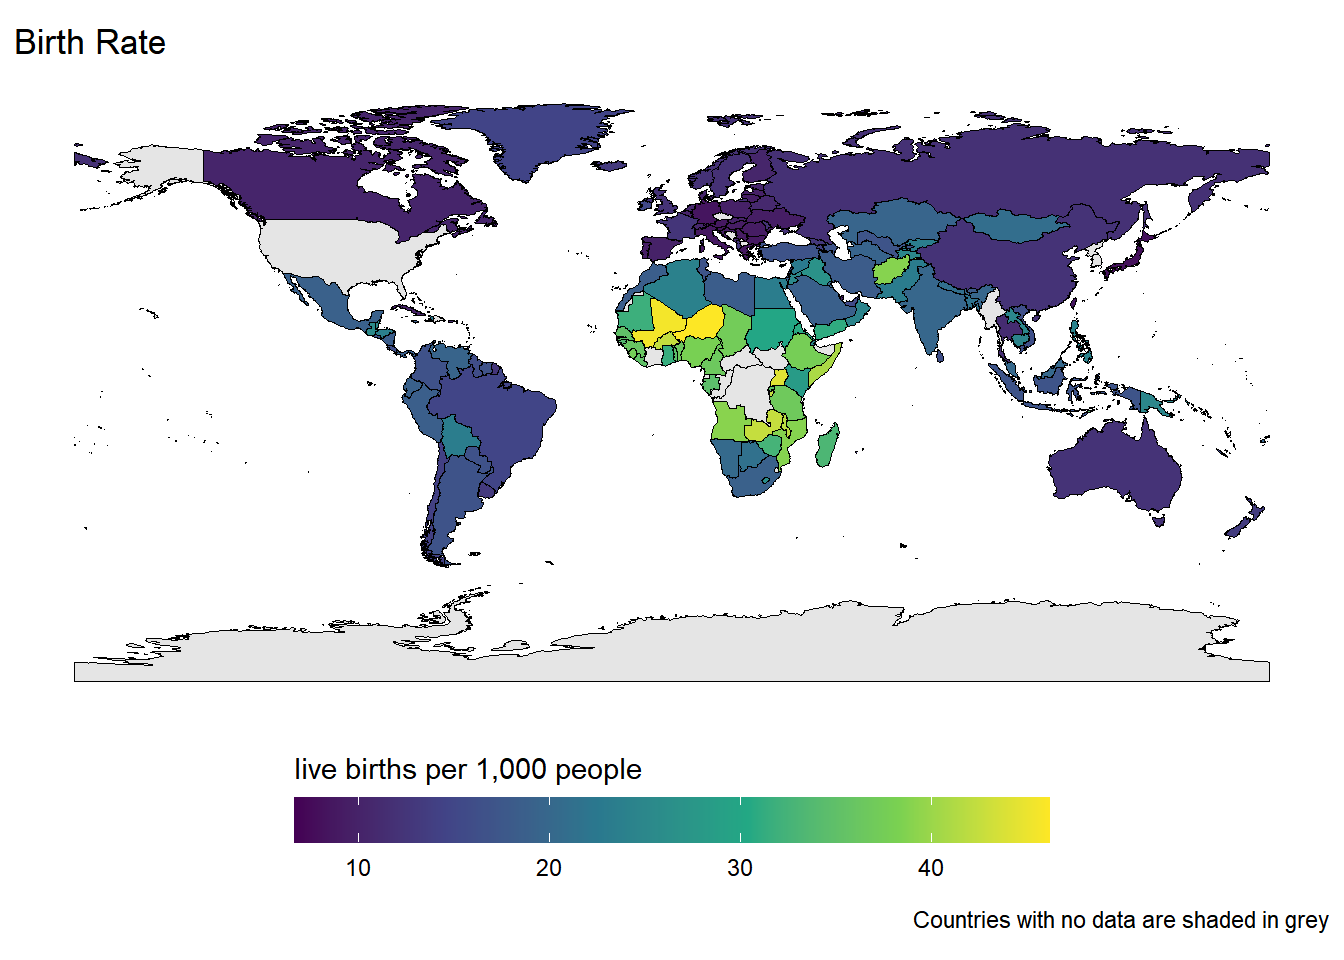
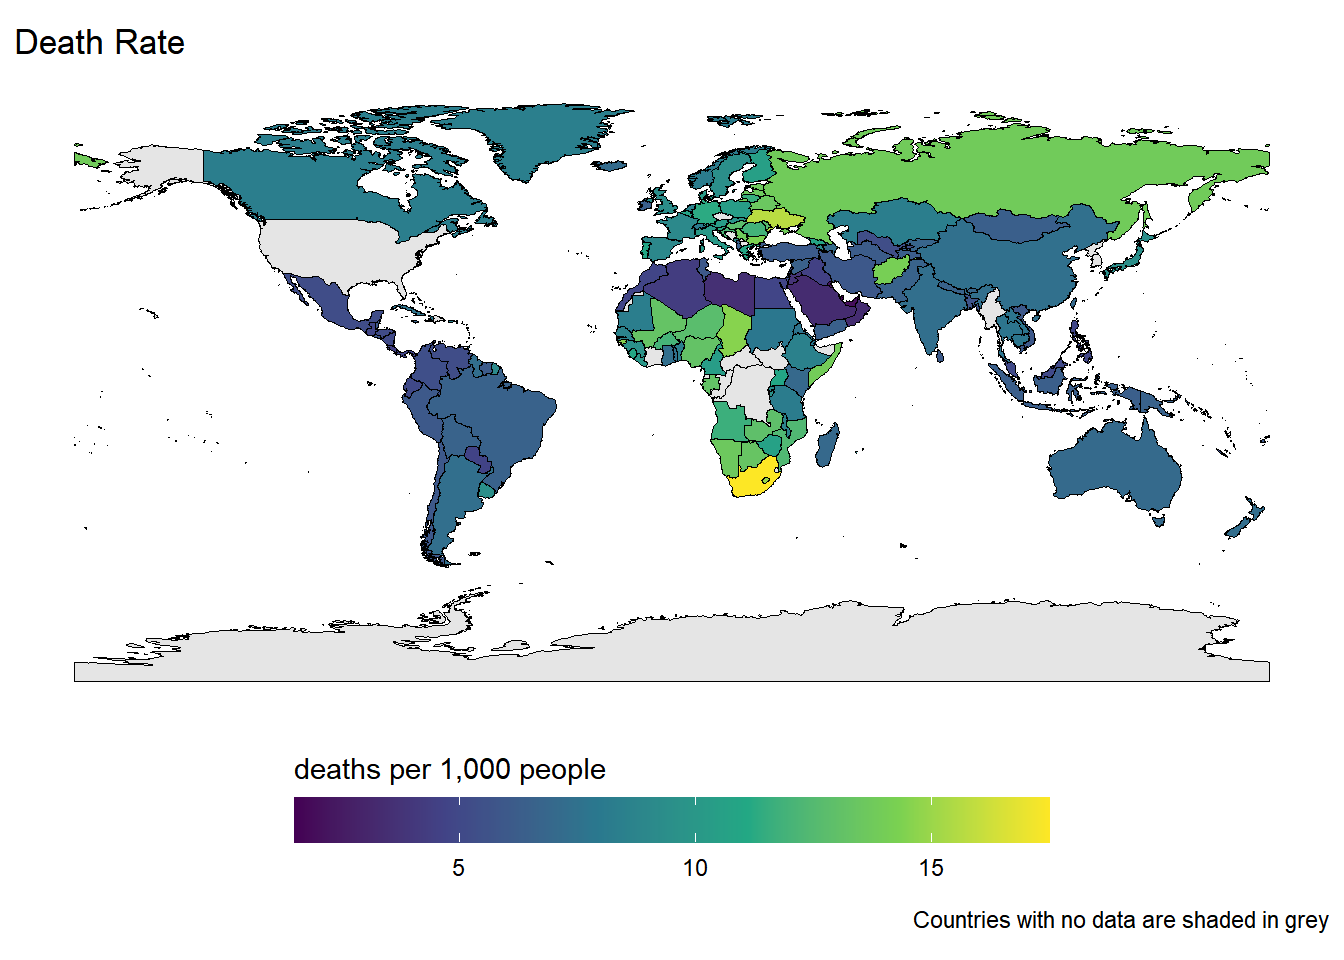
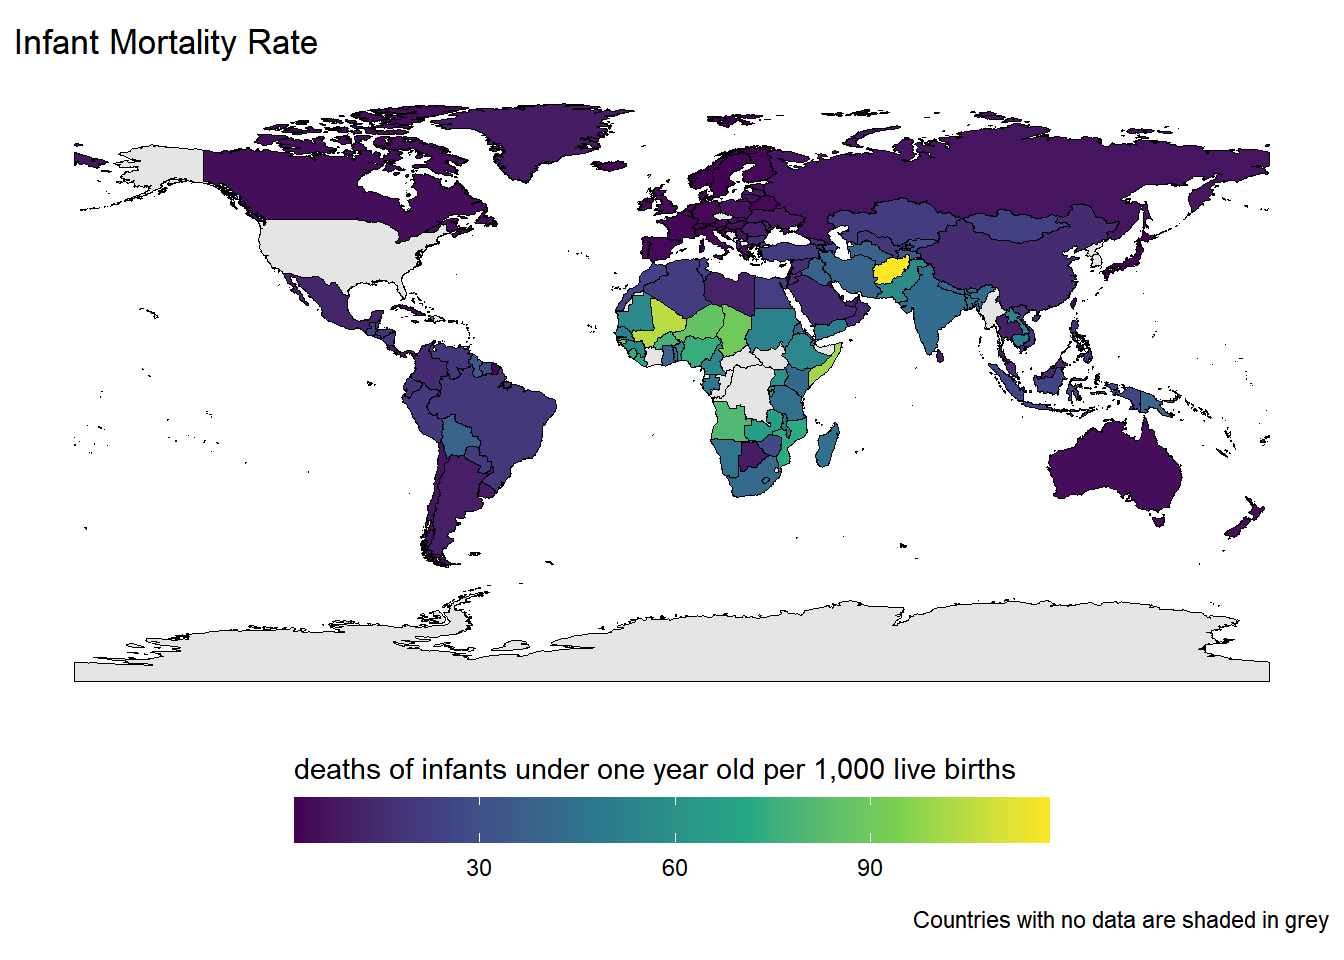
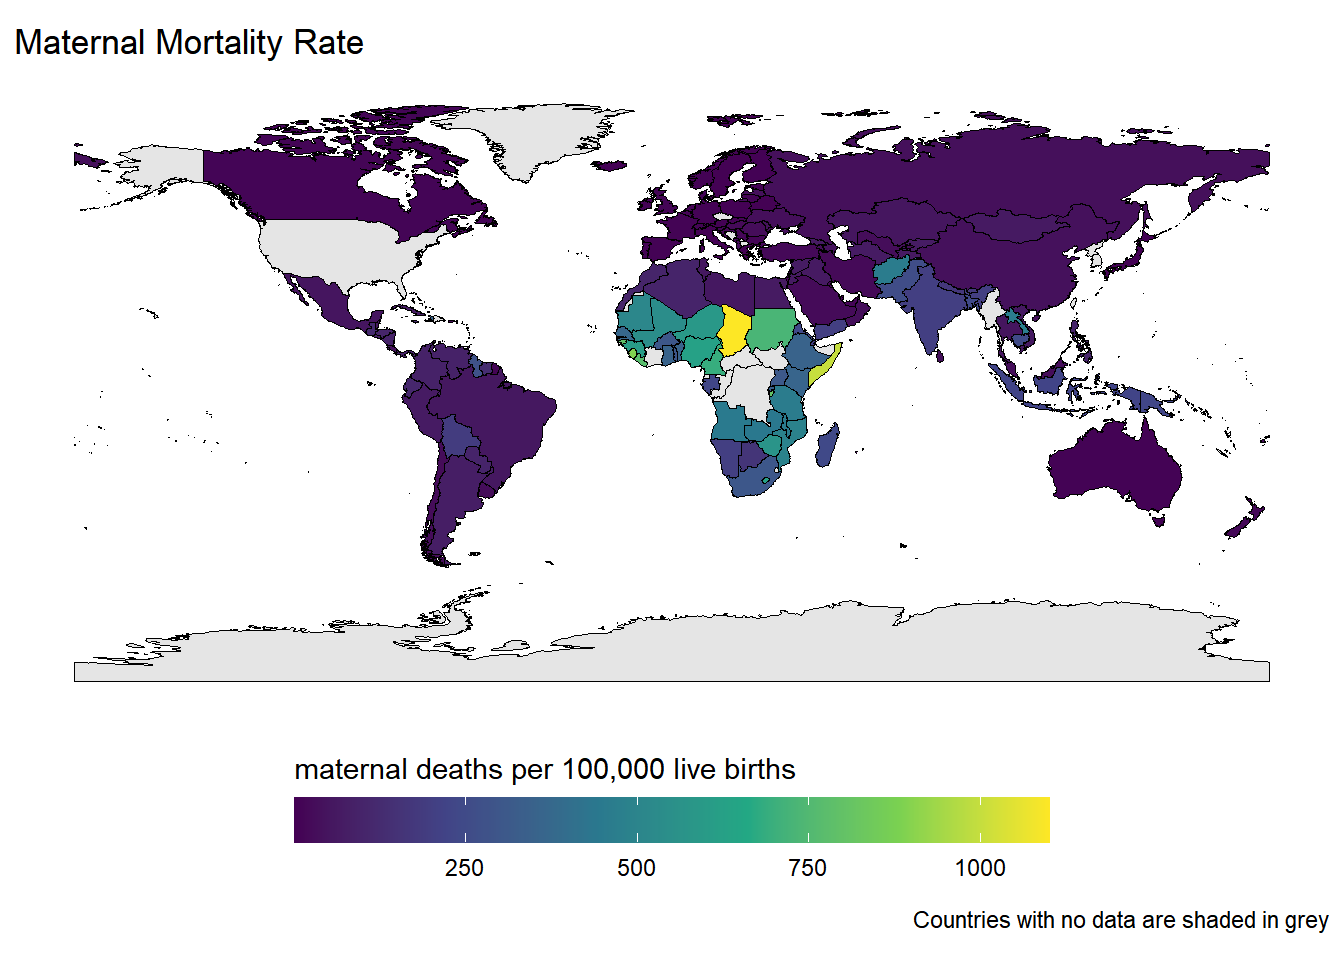
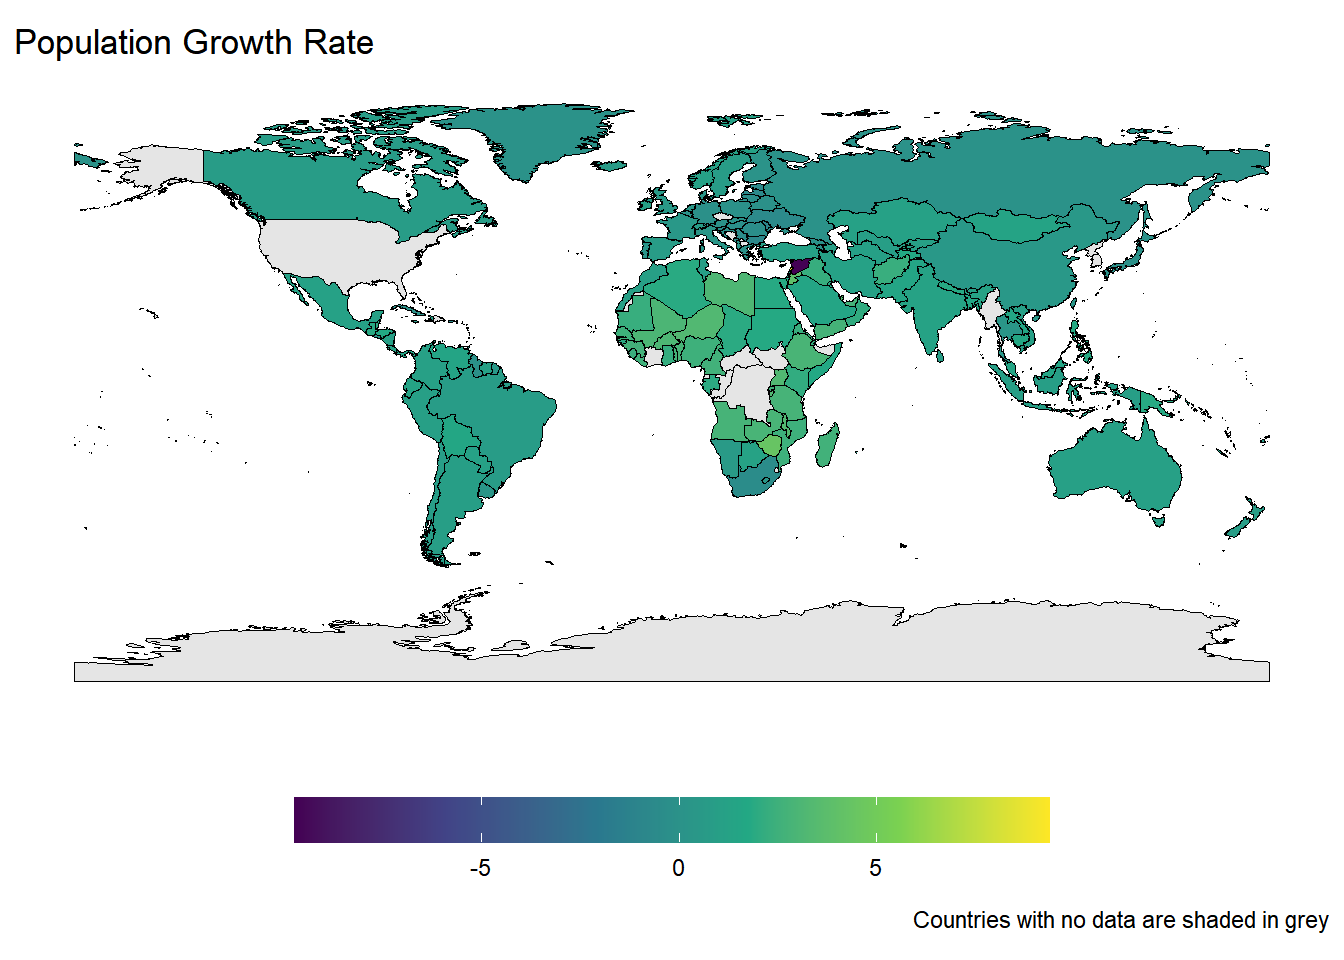
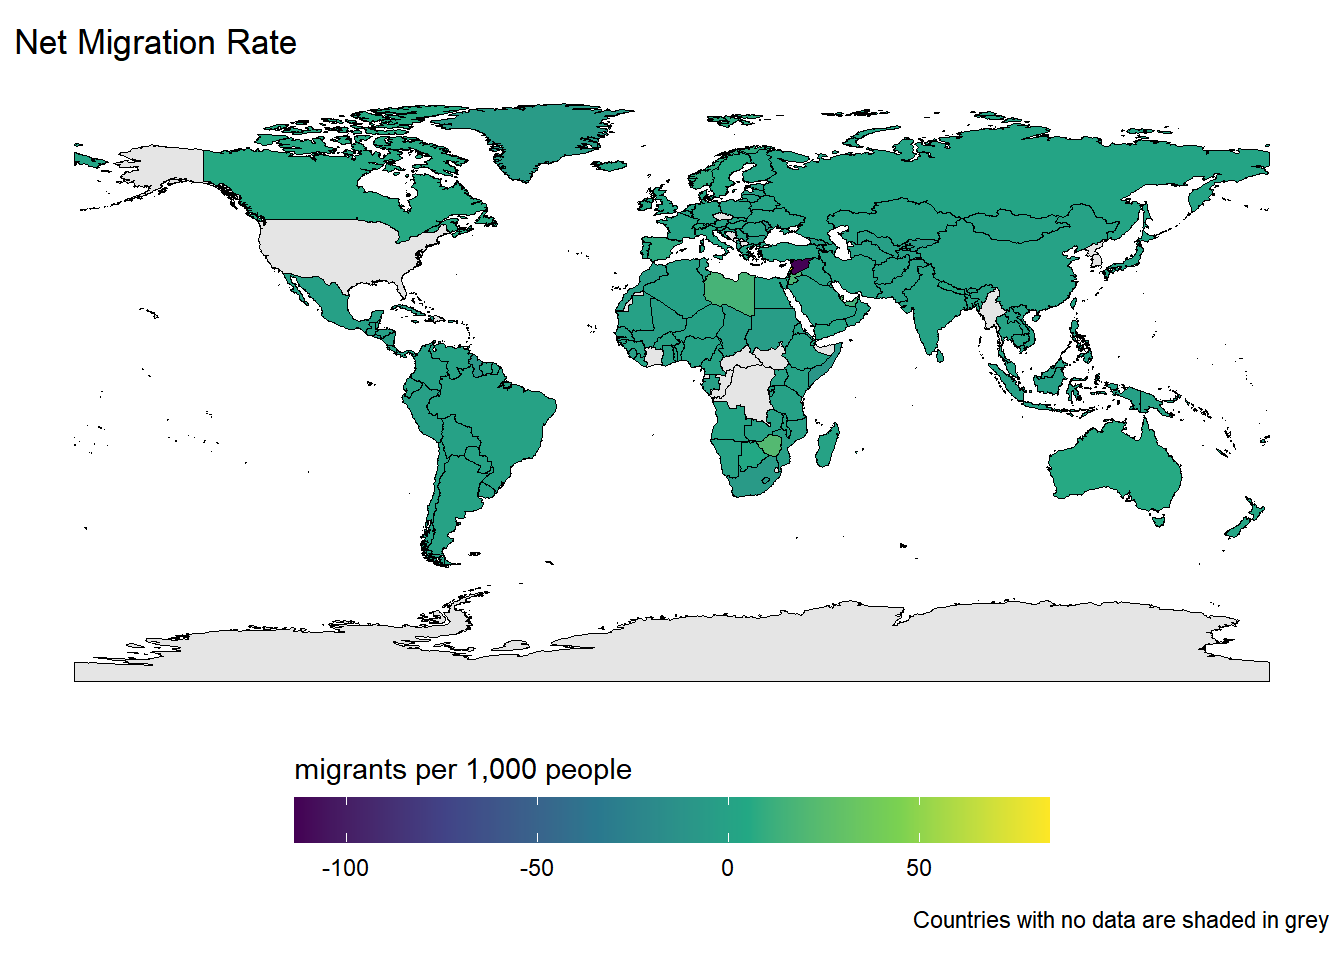
Since the data are country specific, the following visualizations are plotted on maps. Some of the popular libraries for plotting data on maps are sf, rnaturalearth, and tmap . The following code creates a function that can be reused to plot different variables without having to redefine the plotting parameters each time.

Code
world <- ne_countries(scale = "medium", returnclass = "sf")

cia_world_data <- world |> 
  left_join(cia_factbook, by = c("name" = "country"))

map_cia <- function(data, var, title, value) {
  ggplot(data = data) +
    geom_sf(aes(fill = {{ var }}), color = "black", size = 0.1) + 
    scale_fill_continuous(type = "viridis", na.value = "grey90", name = value, limits = NULL) +
    labs(title = title, caption = "Countries with no data are shaded in grey") +
    theme_minimal() +
    theme(
      legend.position = "bottom",
      axis.text = element_blank(),
      axis.ticks = element_blank(),
      panel.grid = element_blank(),
      legend.text.position = "bottom",
      legend.title.position = "top",
      legend.key.width = unit(2, "cm")
    )
}

map_cia(cia_world_data, internet_users, title= t_interetuser$title, value = t_interetuser$unit)
map_cia(cia_world_data, population, title = t_population$title, value = t_population$unit)
map_cia(cia_world_data, birth_rate, title = t_birth_rate$title, value = t_birth_rate$unit)
map_cia(cia_world_data, death_rate, title = t_death_rate$title, value = t_death_rate$unit)
map_cia(cia_world_data, infant_mortality_rate, title = t_infantMR$title, value = t_infantMR$unit)
map_cia(cia_world_data, maternal_mortality_rate, title = t_maternalMR$title, value = t_maternalMR$unit)
map_cia(cia_world_data, population_growth_rate, title = t_population_growth_rate$title, value = "")
map_cia(cia_world_data, net_migration_rate, title = t_netmigration$title, value = t_netmigration$unit)
Figure 2
Figure 3
Figure 4
Figure 5
Figure 6
Figure 7
Figure 8
Figure 9

After seeing some general information of each variables on the above plots, now lets focus on the main question of the tidy Tuesday challenge

Note

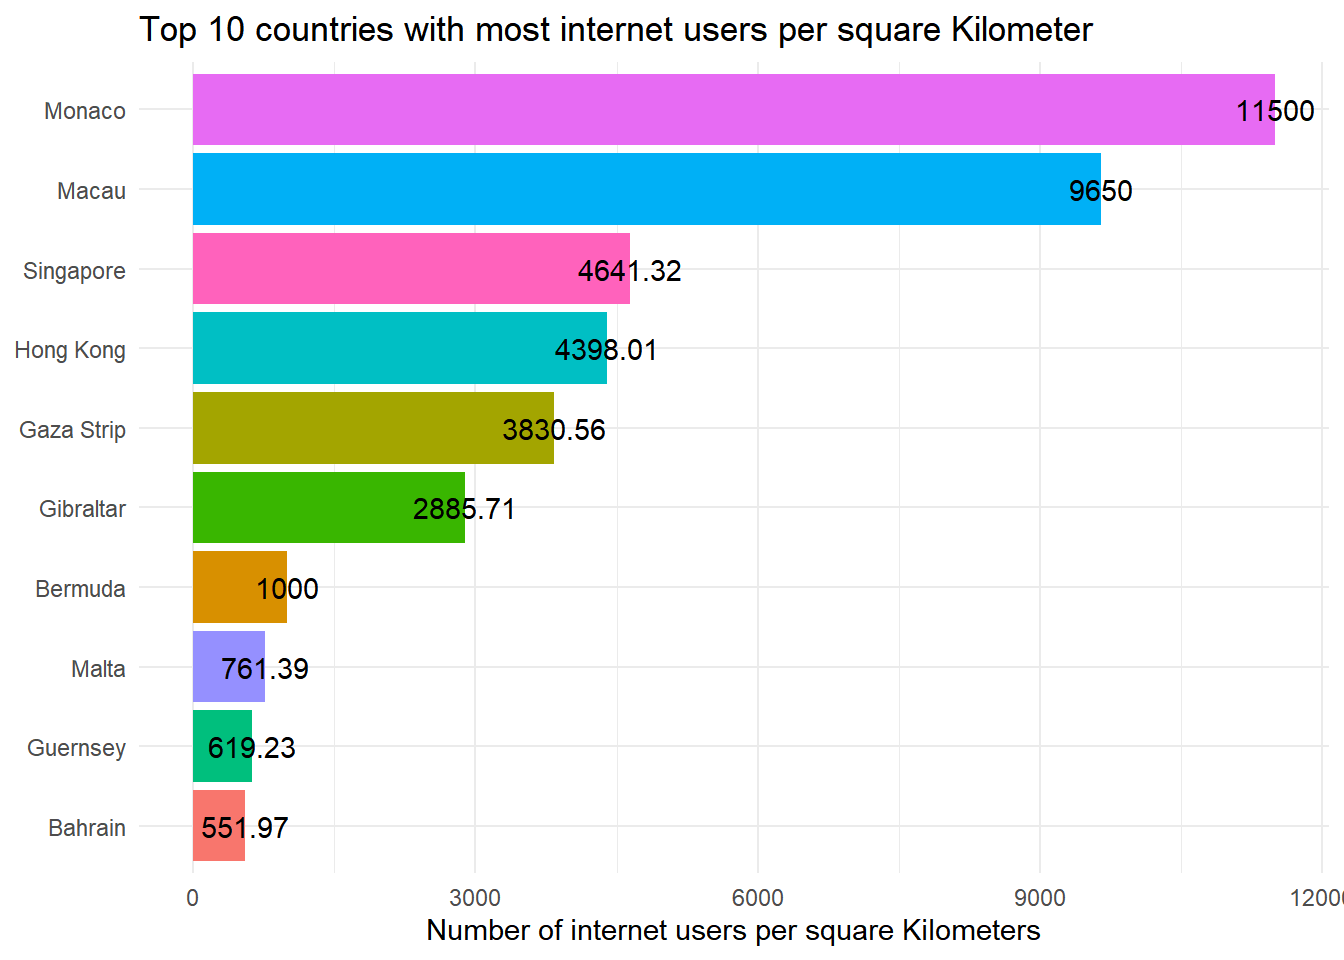
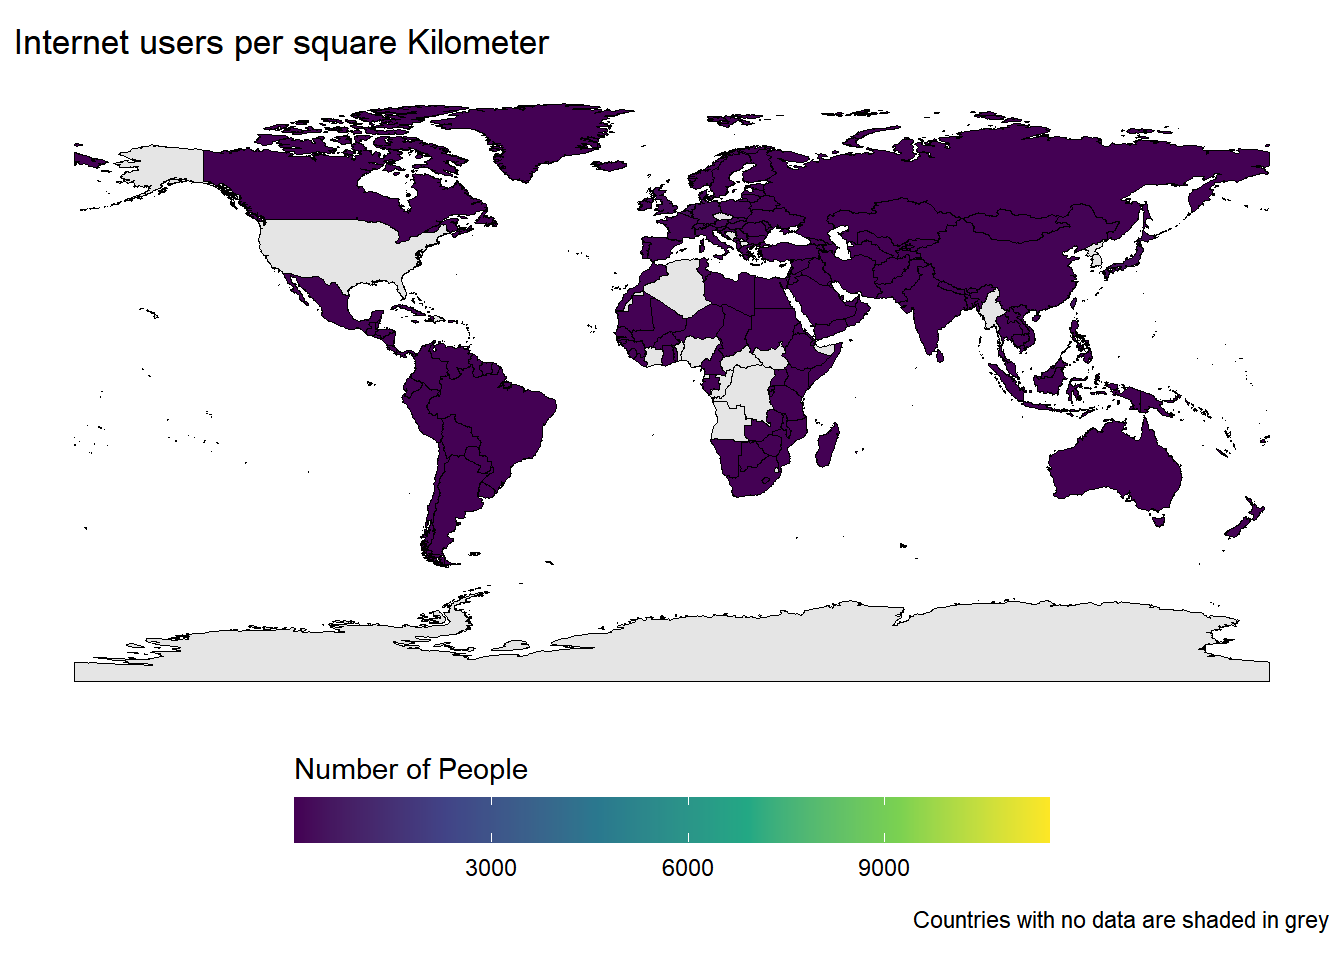
Which countries have the highest number of internet users per square kilometer?

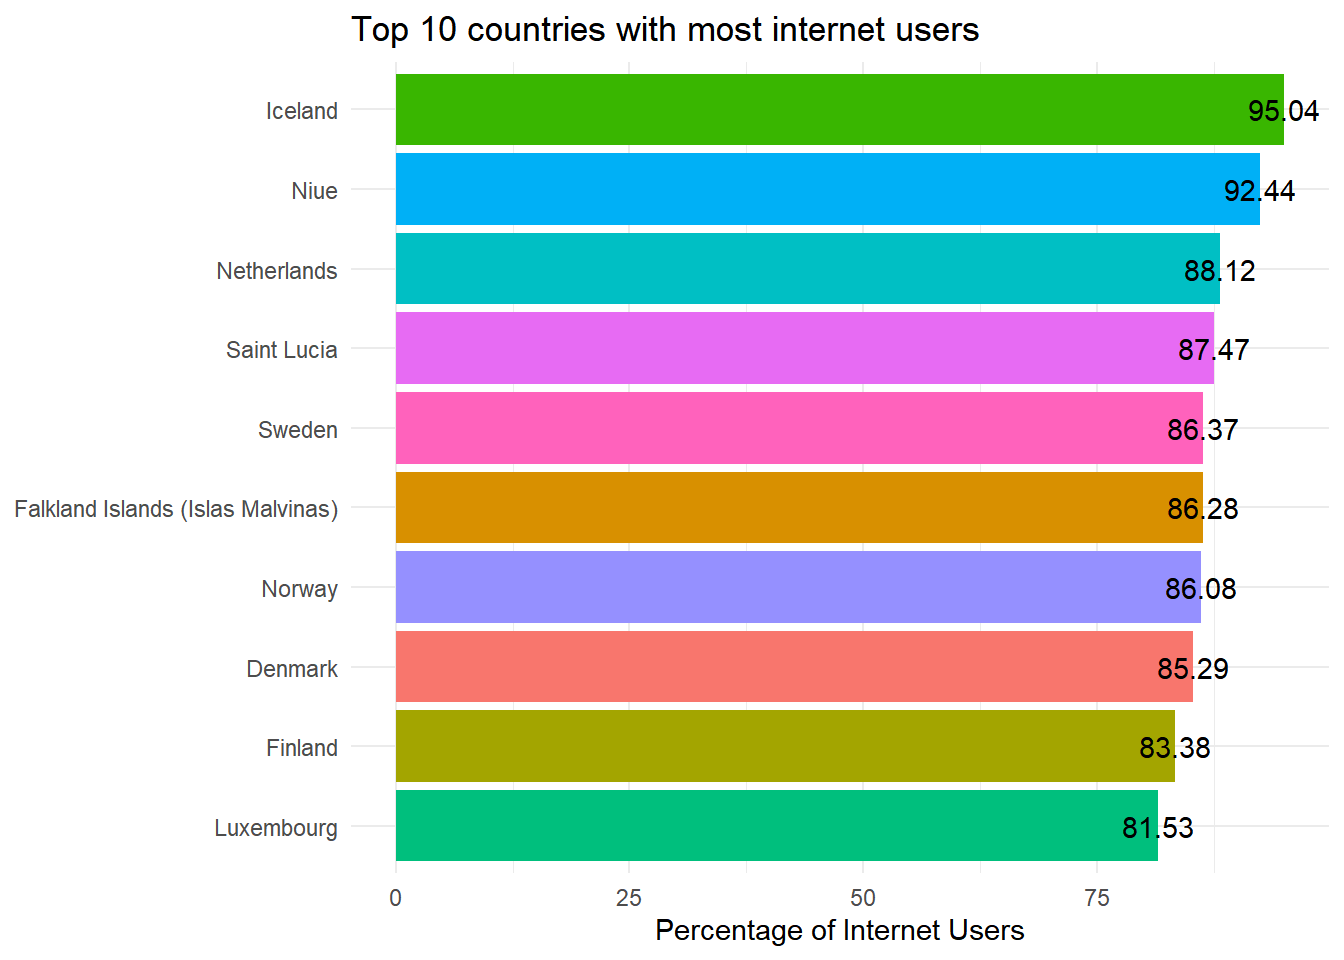
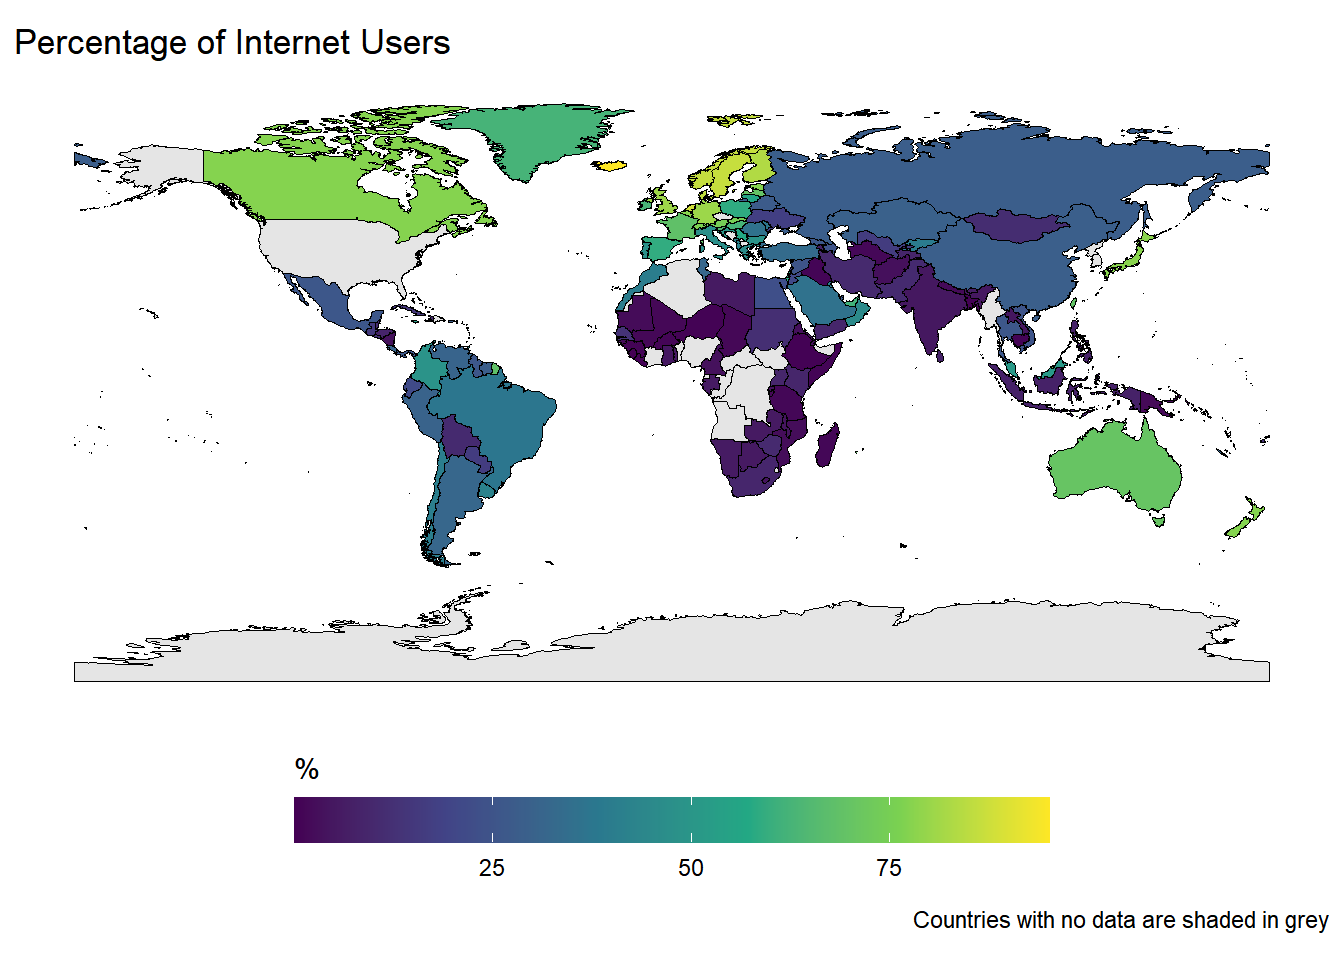
Which countries have the highest percentage of internet users?

To answer the above questions, new variables need to be computed. For the first question, the computed variable is “internet_users_per_square_Km”, and for the second one, “percentage_internet_users”

Code
top10 <- cia_factbook |> 
  mutate(
    internet_users_per_square_Km = internet_users/area,
    percent_internet_users = (internet_users/population)*100,
    .keep = "all"
  )

p1 <- top10 |> arrange(desc(internet_users_per_square_Km)) |> slice_head(n=10) |> ggplot(aes(x = reorder(country, internet_users_per_square_Km), y = internet_users_per_square_Km, fill = country))+
  geom_bar(stat = "identity", show.legend = FALSE)+
  coord_flip()+
  labs(
    title = "Top 10 countries with most internet users per square Kilometer",
    y = "Number of internet users per square Kilometers",
    x = NULL
  )+
  geom_text(
    aes(label = round(internet_users_per_square_Km, 2)),
    position = position_dodge(width = 0.5)
  )+
  theme_minimal()
  
p2 <- top10 |> arrange(desc(percent_internet_users)) |> slice_head(n=10) |> ggplot(aes(x = reorder(country, percent_internet_users), y = percent_internet_users, fill = country))+
  geom_bar(stat = "identity", show.legend = FALSE)+
  coord_flip()+
  labs(
    title = "Top 10 countries with most internet users",
    y = "Percentage of Internet Users",
    x = NULL
  )+
  geom_text(
    aes(label = round(percent_internet_users, 2)),
    position = position_dodge(width = 0.5)
  )+
  theme_minimal()

p1
p2

cia_internet_data <- world |> 
  left_join(top10, by = c("name" = "country"))

map_cia(cia_internet_data, internet_users_per_square_Km, title = "Internet users per square Kilometer", value = "Number of People") 
map_cia(cia_internet_data, percent_internet_users, title = "Percentage of Internet Users", value = "%")
Figure 10
Figure 11
Figure 12
Figure 13

To answer the questions for this tidy tuesday challenge we have computed 2 variables using the data provided in the CIA fact book. From which we can see the top 10 countries with highest number of internet users per square kilometer and countries with highest internet user percentage.